What is Query Store?
Query store has introduced for performance troubleshooting process. Queries having multiple plans: Store the history of query plans in the system
- Execution Plans and runtime statistics
- Stores the insight information of each queries i.e. Resource usage, database usage
- Identify queries that have “gotten slower recently”
- Identify un-efficient plans and force a better plan
Make sure this works across server restarts, upgrades, and query recompiled

Why Query Store ?
- Explore the queries execution
- Resource consuming queries
- Figure out query plan
- Identify possible performance degradation queries
- Figure out why regressions happen
- Force the query processor to use a particular plan
- Query Store is accessible through Transact-SQL.
- Identify and improve ad-hoc workloads
- Pinpoint and fix queries
- Custom reporting and/or alerting through
- Dynamic Management Views (DMVs)
How Setup Query Store
Enabled Query Store to capture query execution plans and runtime statistics :
SQL Server Management Studio
- Object Explorer and Right click on selected database
- GO to Properties option
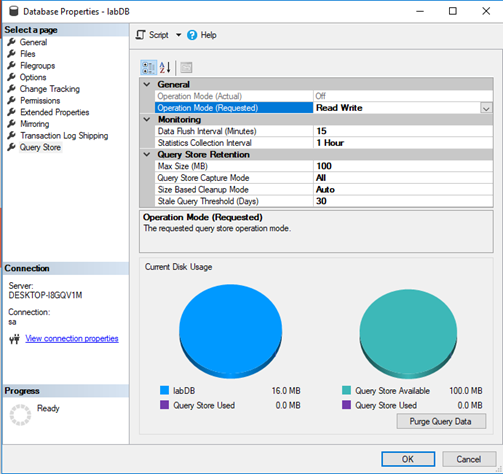
- select the Query Store page
- Set Operation Mode =Read Write & Click OK
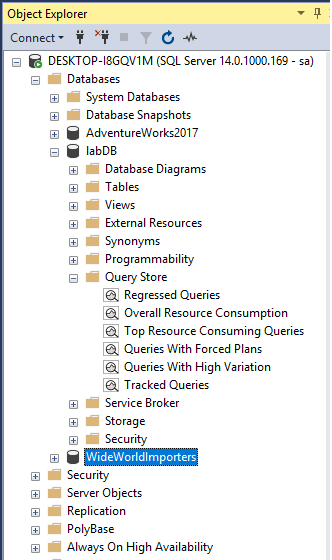
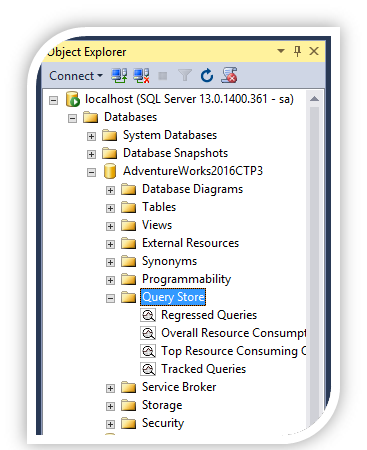
- Refresh and expand the database
- SQL Server Query Store folder will appear with the list of available built-in reports

How Setup Query Store
Enable Query Store :
ALTER DATABASE [AdventureWorks2017] SET QUERY_STORE = ON;
GO
In the Data Flush Interval (Minutes) option, shows how frequent the query runtime statistics and query execution plans will be flushed from memory of SQL Server instance to disk.
ALTER DATABASE AdventureWorks2017
SET QUERY_STORE = ON
( DATA_FLUSH_INTERVAL_SECONDS = 900 );
Statistics Collection Interval option:
Statistics Collection Interval option defined aggregation interval of query runtime statistics.
Max Size (MB) option :
is for configuring the maximum size of the SQL Server Query Store. The data in the SQL Server Query Store is stored in the database where the SQL Server Query Store is enabled. The SQL Server Query Store doesn’t auto grow and once the SQL Server Query Store

Query Store Setup Options
- Off – The SQL Server Query Store turned off
- Read Only – This mode indicates that new query runtime statistics or executed plans will not be tracked (collected)
- Read Write – Allows capturing query executed plans and query runtime statistics
- Data Flush Interval (Minutes) option, an interval in minutes can be set which shows how frequent the query
runtime statistics and query execution plans will be flushed from memory of SQL Server instance to disk.
- Statistics Collection Interval option defined aggregation interval of query runtime statistics that should be used inside
the SQL Server Query Store. By default, it is set to 60 minutes. Lower value means that granularity of query runtime
statistics is finer, because of that, more intervals occur which requires more disk space for storing query runtime statistics.
- Max Size (MB) option is for configuring the maximum size of Query Store. SQL Server Query Store doesn’t auto grow and once the SQL Server Query Store reaches the maximum size, the Operation Mode will be switched to the Read Only mode, automatically, and new query execution plan and query runtime statistics will not be collected:
- Query Store Capture Mode option determines what type of query will be captured. Default, mode All, which means that every executed query will be stored. Autothen try to ignore infrequently executed and other ad hoc queries. When the None value is chosen, then Query Store will not gather information for the new queries and will continue gathering information only on the queries that it has been recorded previously.
- Size Based Cleanup Mode option is for cleaning the SQL Server Query Store data when the maximum size in the
Max Size (MB) option is reached to 90% of capacity.
- Stale Query Threshold (Days) option is for defining how long the data will stay in the SQL Server Query Store.
- SQL Server Query Store tab is an option that clears/purges all data in the SQL Server Query Store by
pressing the Purge Query Data button.
Query Store troubleshooting
By navigating the Query Store sub-folder under the database node :
Regressed Queries: Pinpoint queries for which execution metrics have recently regressed (i.e. changed to worse).
Overall Resource Consumption: Analyze the total resource consumption for the database for any of the execution metrics.
Top Resource Consuming Queries: Choose an execution metric of interest and identify queries that had the most extreme values for a provided time interval.
Queries With Forced Plans: Lists previously forced plans using Query Store. Query plan analysis and forcing query plans needs higher level expertise on SQL Server.
Queries With High Variation: Analyze queries with high execution variation as it relates to any of the available dimensions, such as Duration, CPU time, IO, and Memory usage in the desired time interval.
Query Wait Statistics: A useful view to analyze wait categories that are most active in a database, and which queries contribute most to the selected wait category.
Tracked Queries: Track the execution of the most important queries in real time.
